Back to Whitepapers

Introduction

Providing excellent customer support is a challenge across all industries, but meeting that challenge is essential for success. That’s particularly true for retail businesses, where customer support teams serve as a direct line of contact between buyers and companies. Each interaction has the potential to make or break a sale, to drive repeat purchases, or form an opinion of your brand.

But at this point, retail store owners are well aware of the importance of great support. The challenge, then, is knowing what that support should look like, and whether your brand stacks up to both your competitors’ and your customers’ expectations. After all, without clear benchmarks, it can be difficult to know whether the level of customer support you provide is adequate (and, if not, where you have room for improvement).

At Freshdesk, we know that retailers strive to deliver the best possible shopping experiences to their customers. But considering how quickly customer support standards and consumer preferences can change, delivering top-notch experiences requires staying on top of trends and regularly evaluating your strategy. In this white paper, you’ll find benchmarks for key customer support metrics unique to retail. You’ll also find up-to-date information regarding customer preferences and support trends, along with our predictions for this industry in the coming years.

The information we’ve included is a combination of both our original research on customer support benchmarks, as well as data collected from other industry-leading publications. Our goal is that by the time you’ve finished reading this white paper, you’ll have the insight you need to adjust your strategy to better meet your customers’ needs and to take a more informed approach to serve them moving forward.

Continue reading

Chapter 1: The Importance of Great Customer Support

If you’re reading this report, you’re already aware that customer support is an essential factor in retail success. Still, having a clear understanding of just how important a factor it is can help you prioritize it appropriately. One of the best ways to gauge this is by examining how customers respond when companies don’t meet their service expectations.

Top Responses to bad service

After experiencing bad service, 47% of consumers will no longer conduct business with the company and 45% will warn their friends and family about that brand. These metrics indicate that poor customer service has a clear and negative impact on both customer retention and brand reputation. Responses to good service, on the other hand, are almost the mirror opposite.

response to bad service 2x response to bad service 2x

Top Responses to good service

In response to good service, 55% of consumers will recommend a company to friends and family, and 47% will conduct more business with the company. It should come as no surprise, then, that support is a priority for today’s shoppers, with 63% of consumers reporting that good digital customer service is very important in their loyalty to a brand.

response to bad service 2x response to bad service 2x

How important is good digital customer service in your choice of, or loyalty to, a brand?

It’s also worth noting that for many of today’s shoppers, great support is more important than brand loyalty. In fact, 59% of American consumers1 say that they’d try a new brand or company for a better service experience. In this sense, customer support can be a crucial selling point for retailers — and a competitive advantage for those who provide it.

choice of loyalty 2x choice of loyalty 2x

Chapter 2: Customer Support Benchmarks

The easiest way to assess customer support metrics is by comparing them to past performance. And while this is an effective way to monitor improvement, it doesn’t tell you how the level of support you provide compares to what consumers experience with other businesses.

That’s why, in our Customer Happiness Benchmark Report, we examined anonymized user data on the support interactions of approximately 7,000 companies. In this analysis, we established concrete benchmarks for five of the most important customer support metrics: one-touch resolution, first response rate, resolution SLA, number of responses to resolution, and customer satisfaction. Then, we broke this data down by region to get a better idea of how customer support and consumer expectations vary around the world.

benchmarks 2x benchmarks 2x
71% Average One-touch Resolution

The average one-touch resolution, or first-call resolution (FCR), indicates how many tickets get resolved within the first response from a customer support team. This metric can give you a basic idea of the complexity of the inquiries your team receives, as a high one-touch resolution signals that your agents can resolve the average problem with a single message.

7 Hour Average First Response

f there hasn’t been enough precedence for an issue to be documented but you’re sure it has happened before, look for it in your helpdesk. Search for it, and see how the agent on it handled it.

If it’s not a specific issue but a broader type of issue that you need help with, use filters to narrow down your search results and see what has been done by more experienced agents in the past. This way, you learn enough to smoothly resolve interactions with customers irrespective of whether you’ve found a solution.

86% Resolution SLA

Most companies have a service level agreement, or SLA, that lets customers know that they will resolve their issue within a specific period of time. This time varies by company but is used to give customers an accurate idea of when they can expect a response.

Across the companies in our study, 86% of tickets were resolved well within SLA. Knowing where your support team stands can help you determine whether they’re adequately equipped to meet the expectations you’re setting with customers.

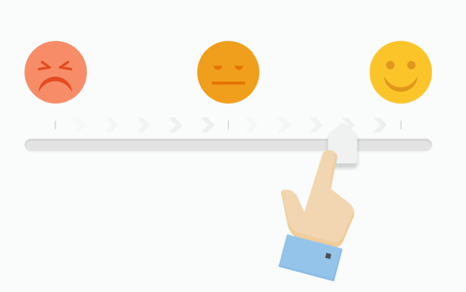
78% Customer Satisfaction

Arguably the most important metric of all, the customer satisfaction metric indicates how many customers in our analysis reported that their interaction with a support agent was a positive one.

In this case, 78% of the customers in our study were happy with the service they received. So if your customer satisfaction score currently falls under this, you may have some work to do to catch up to your competitors.

And while a score at or above 78% indicates that your customer support is in fairly good standing, it’s important to remember that there’s always room for improvement — especially when those improvements can have a significant impact on customer retention and sales.

Benchmarks by Region

The five metrics above all represent worldwide averages of the data we collected. If you’re interested in data specific to your region, or simply want to learn how these metrics vary around the world, we’ve broken it down in the chart below.

REGION AVG. FCR TIME RESOLUTION TO SLA AVG. CSAT   FCR
ANZ 7 90% 88% 74%
US 6 91% 88% 73%
UK 6 92% 86% 72%
America 7 89% 85% 71%
Mena 6 88% 82% 74%
Europe 7 91% 82% 71%
India&APAC 7 88% 78% 74%

Though there are slight variances in each metric, we didn’t find any major outliers in any of them. We also found that there was no correlation between average CSAT and first response rate, resolution to SLA, or one-touch resolution.

Chapter 3: Retail Benchmarks

Though how customer support trends and technology have evolved are relatively consistent across all industries, customer needs vary within each industry. And this should come as no surprise, given that the buying processes are very different for a retail shopper than, say, a consumer looking for a new financial advisor or health insurance plan.

In fact, retail companies receive five times the conversational volume of service-based businesses every month and three times the volume of SaaS companies. As a result, there are slightly different customer support benchmarks when evaluating retail businesses, specifically. Examining these metrics can be a helpful way to gauge where your business stands in comparison to others like yours

One of the most helpful resources for this data is the American Customer Satisfaction Index or ACSI2. With the ACSI model, customer satisfaction is illustrated in a way that includes both cause and effect, with drivers of satisfaction on the left, customer satisfaction in the center, and the outcomes of customer satisfaction on the right.

customer satisfaction index 2x customer satisfaction index 2x

When we put this with the results in our benchmark report, we found that the average CSAT for the retail industry is 43%. This indicates that there is plenty of scope for retail businesses to improve on. And with each improvement you make to your support strategy, you make a direct impact on customer loyalty and retention rates. This means that investing in great service isn’t only beneficial to your customers — it can also move you closer to other key business goals.

Chapter 4: Consumer expectations & preferences

Now that we’ve established a few key customer support benchmarks, we can dig deeper into the reasons for these scores. Given that customer satisfaction is determined by how effectively a company meets consumers’ expectations, the best way to do this is to learn more about what those expectations are.

For starters, customer expectations are high — and increasingly so. Forrester surveyed retail customers to identify what drives purchases. The survey result showed that 47% of the customers expected prompt service at the retail stores.

State of retail industry

This is because customers are aware that customer support technology is continuing to improve, and that more businesses are making support a priority. As a result, they expect their own experiences to improve accordingly. So if you’re not yet taking steps to deliver better customer experiences, it’s time to re-think your approach.

customer expectations 2x customer expectations 2x

Customer Support Metrics to watch out for

Your customers want great service — that much is clear. But what’s less clear is what, exactly, “great” service looks like to the average consumer. This can make it challenging to develop a strategy that meets their needs and expectations. But when asked what the most important aspects of a good customer experience are, many customers share the same priorities.

Convenience, customer experience, and competitive pricing have a direct impact on buying decisions. Retailers on the other hand need to focus on driving these expectations and building customer loyalty and long-term relationships with consumers.

Consumers prefer authentic interactions with the brands they buy from. They expect the pricing to be competitive and have easy access to product information. They also want the retail brands they buy from to be socially responsible. And retailers who understand these requirements can step up their customer service game.

Channel Preferences

Beyond general aspects like personalization and authentic interactions, consumers also have preferences about which channels they use to contact companies for support. The most obvious benefit of learning these preferences is that you can use it to make informed decisions about the channels included in your customer service strategy.

Beyond that, it can also help you make sure that you’re prioritizing your channels appropriately and delivering the level of service your customers expect on each. And when you consider how quickly these preferences can change as consumers become more familiar with new channels, it’s important to keep an eye on them on a regular basis

It likely won’t surprise many retail store owners, though, to find that the general preference is for digital. Today, 65% of consumers say that digital customer support channels are more convenient, and 50% report that they’re quicker than other channels. That said, there are some slight variances in channel preference by generation.


preferred channel 2x preferred channel 2x


All age groups favor email, with 70% of consumers citing it as a preferred communication channel. This percentage is slightly higher for Gen X and Baby Boomers at 71% each, and somewhat lower for Millennials at 67%. The next most popular channel, mail, is a bit more surprising — but it won’t come as a surprise to many that Baby Boomers are more in favor of it than their younger counterparts.

And although the phone is one of the most established forms of customer support, only 22% of consumers in this study cited it as a preferred channel and slightly less than this for both Millennials and Gen X respondents.

Finally, it’s worth noting that while social media is the lowest-ranked channel overall, it’s also the channel with the largest variation between age groups. Although just 3% of Baby Boomers prefer it as a support channel, that number jumps to 26% for Millennials — exceeding this age group’s preference for both phone support and mail.

One of the biggest takeaways from this data, then, is that you should tailor your approach to your target audience

If your goal is to serve Baby Boomers, for example, a strategy focused on email and direct mail may be perfectly in line with your customers’ preferences — but the same approach could easily fall short for a Millennial audience.

So as you select channels for your support strategy, make sure to tailor them to your target audience and not just consumers as a whole, as there may be significant discrepancies between these two groups.

Email Expectations

Considering the overwhelming consumer preference for email, it makes sense that this channel is widely considered a standard for customer support. One survey found that 79% of U.S. consumers3 report using email as a customer service channel.

This means that the majority of retailers are already using it as part of their support strategies — and that if your business isn’t, you’re likely behind the curve in terms of customer service. But beyond merely offering email as an option, it’s also important to know what consumers expect from this channel so that you can make sure you’re meeting those expectations. And though the general expectations are similar across most channels, they vary the most when it comes to average response time.

email response time 2x email response time 2x

Customer Support Metrics to watch out for

If your business responds to emails within one day, you’re already meeting 43% of consumers’ expectations (and exceeding them for an additional 13%). That said, 44% of consumers expect a response within four hours and 11% within a mere 15 minutes.

Of course, that’s not to say that you shouldn’t offer email support if you’re unable to meet these benchmarks. But it does mean that improving response times may be a priority to focus on moving forward to provide the level of support your customers want.

Social Media Expectations

Social media has grown significantly in popularity as a support channel over the past few years. As of 2018, 63% of consumers4 say they’ve used a social media channel for customer service.

Based on this information alone, many retail store owners may be inclined to add social media channels to their support strategies. And while this is an excellent idea for businesses with strong support teams, it’s important to note that the expectations on these channels are high. For example, the average expected response time to a Twitter direct message is significantly lower than that of an email support request

social media expectations 2x social media expectations 2x

50% of Twitter users expect a response to their direct messages in one hour or less, and that percentage jumps to 70% for four hours. So while an email response within a day meets or exceeds 56% of consumers’ expectations, a Twitter response within the same time frame will only satisfy 30% of users.

This indicates that today’s consumers expect significantly faster responses on social media. So if you’re considering adding these channels as support options, you need to be prepared to meet these higher expectations. Otherwise, these additions may do more harm to your overall customer satisfaction levels than good. Of course, this isn’t to say that social media isn’t worth it. 55% of consumers5 say they have a more favorable view of brands that respond to customer service questions or complaints on social media

Plus, failure to respond on social channels can cause as much as a 15% increase in churn rate6.

So if your support team is equipped to provide fast, effective service on these channels, they have the potential to make a significant and positive impact on both your brand’s reputation and your customer retention.

But achieving these goals is only possible if you’re able to provide the kind of service your social audience wants — and it’s important to be aware that this may require expanding your support team.


Chapter 5: Looking ahead

The benchmarks and data we’ve included in this report indicate the current state of retail customer support. And while this information is the best way to make sure that your approach is up-to-date as of 2018, it’s also a good idea to look to the future.

After all, if you’re going to invest the time it takes to create a new approach to service and support, it’s in your best interest to consider how you can get ahead of the curve. That’s why, in this section, we’ve collected information on three trends that are likely to have a major impact on customer support in the next few years.

Artificial Intelligence

We cannot talk of the future without a reference made to artificial intelligence (AI). It presents huge opportunities for retail brands to improve the quality of customer service. With the availability of huge amounts of customer data, aided by AI, you can identify customer needs more accurately. This helps you deliver personalized experiences, predictive recommendations, and intuitive carts for an easy shopping experience.

Transparency

Customers now want to know what happens backstage, what goes behind the logo. They want to know what the company’s values are, what their culture is like, or whether they are socially responsible. Hence, it is necessary that retail brands wear the backstory on their sleeve. It is one of those things that make the brand more human.

Automation Commerce

We live in a connected world with customer expectations bordering on instant gratification. You’d know what we are talking about with the rise of on-demand services. And customers are actually willing to let brands make the purchase decisions for them. For instance, Fetch, an AI service uses bluetooth connected devices to track the use of toiletries and automatically order them when you run out on the supplies.

Reimagine Retail

A year from now, in 2019, brands will be expected to reimagine their offerings to address consumers from all demographics and walks of life. This means, that diversity will take center stage and it won’t be about just marketing the products that way but also about creating them. For instance, the customer experiences designed for millennials will need to be different from those designed for Baby Boomers.


References

1. https://blog.freshdesk.com/customer-service-in-retail-a-differentiator/

2. https://www.theacsi.org/

3. https://www.arise.com/resources/blog/customer-service-frustrations-series-email-response-times

4. https://www.conversocial.com/white-papers-and-reports/the-state-of-digital-care-2018

5. https://info.microsoft.com/rs/157-GQE-382/images/EN-CNTNT-Report-DynService-2017-global-state-customer-service.pdf

6. https://blog.freshdesk.com/the-untapped-potential-of-listening-on-social-media/

Top responses to bad service: http://engage.nuance.com/millenialization-customer-service-report

Importance of digital customer service: https://www.conversocial.com/white-papers-and-reports/the-state-of-digital-care-2018

Retail customer service: https://www.bigcommerce.com/blog/retail-customer-service/

State of retail industry: https://media.timetrade.com/wp-content/uploads/2017/02/TimeTrade_State_of_Retail_2017_Report.pdf

Preferred communication channels: http://engage.nuance.com/millenialization-customer-service-report

Email response time expectations: https://www.toistersolutions.com/blog/2018/4/15/how-fast-should-a-business-respond-to-an-email

Related Whitepapers