HELPDESK Analytics
Delight Made Easy with Freshdesk Analytics
Analyze, Action and Augment your business with insightful data. Capture your customer support data to craft experiences that ‘delight’ your customers.

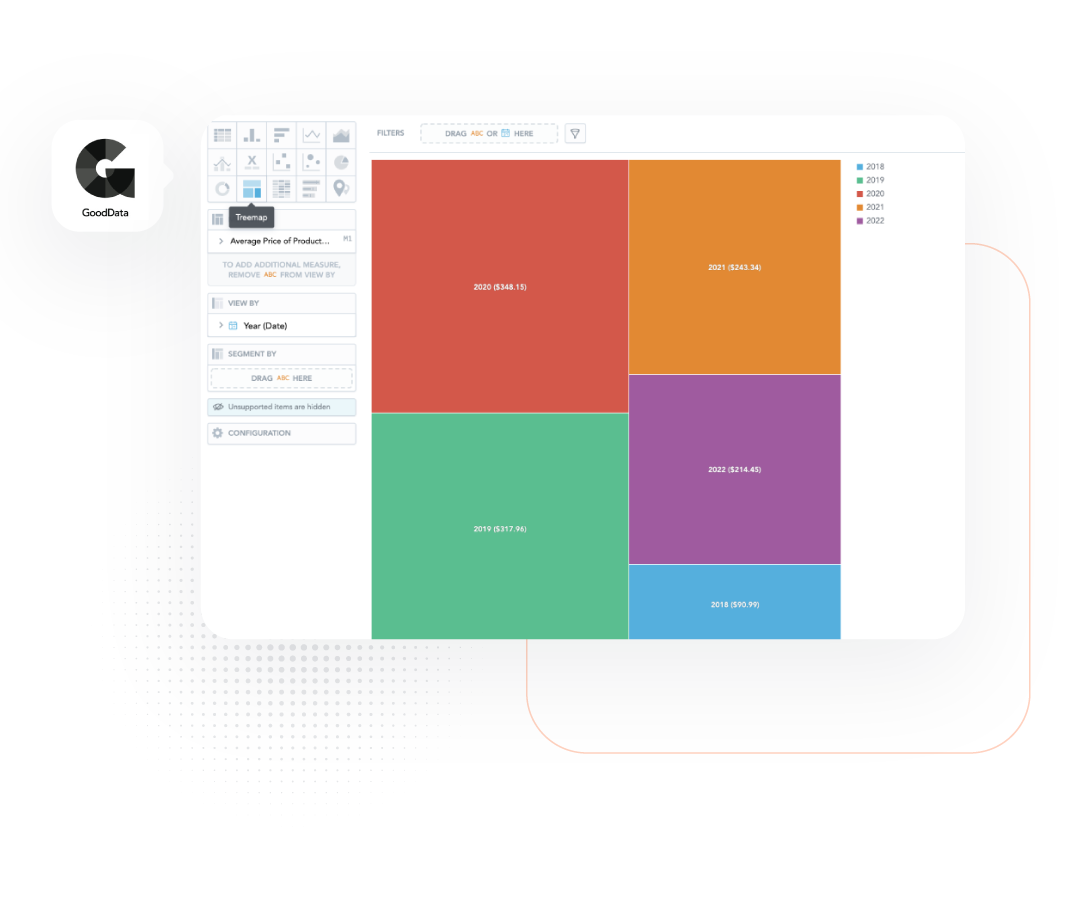
Use handcrafted reports from our library for quick insights. Save time and avoid manual work with an exhaustive set of actionable reports. With brand new visualization capabilities added to the product, you can easily understand large volume of data and present it to stakeholders with rich visuals and vibrant colours

With multiple ways to look at helpdesk reporting, Freshdesk Analytics lets you customize and build your reports in the way you want them — with absolutely no coding and minimal effort. Create reports on the fly without having to depend on a data analyst or external business intelligence tools. Turn every employee in your organization into a decision scientist.

Customize your dashboards to showcase required metrics and enable your teams to make data-driven decisions to meet their support targets. A customized dashboard will give your agents visibility into the tickets that require immediate attention, help them quickly jump in, and assist the team thereby improving the overall metrics. It can also motivate them to make it to the top of the leaderboard.
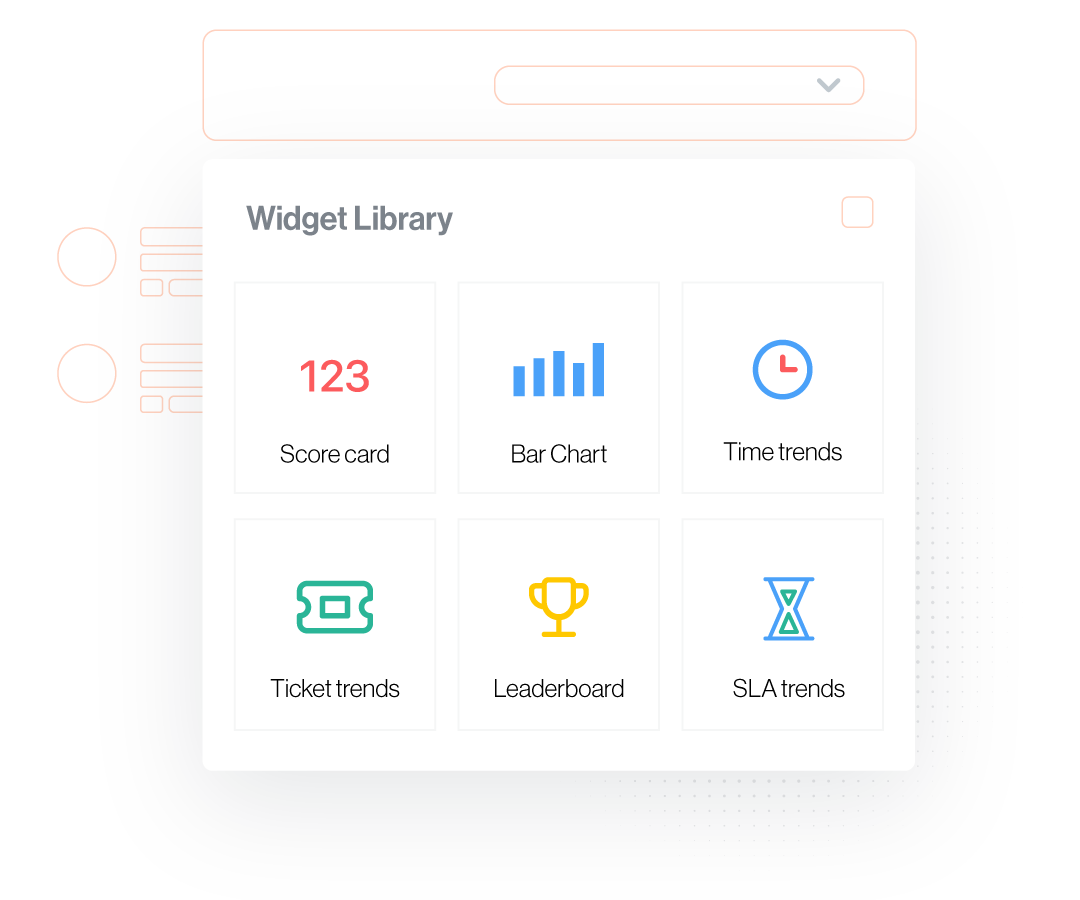
Create reports from scratch, send alerts to admins whenever there’s a spike/drop in numbers, access advanced statistical metrics, and more with this integration. Admins can stay on top of updates with the help of dynamic dashboards and KPI alerts whenever there is a spike/drop in numbers. Drill down data with the help of visualizations like bar charts, bullet charts, etc.

Sorry, our deep-dive didn’t help. Please try a different search term.